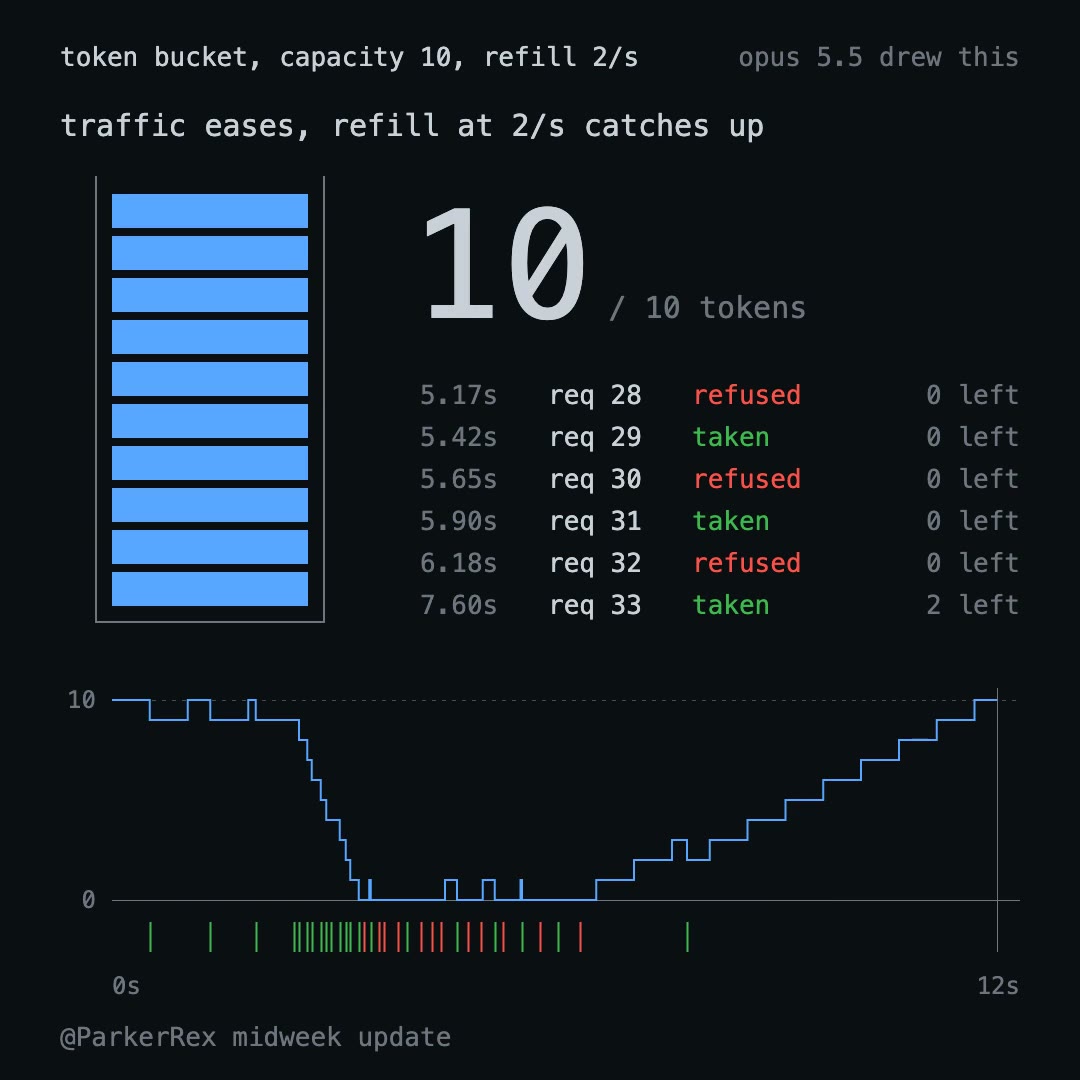
Animated diagram explains a token bucket rate limiter

Parker RexVERIFIED
@ParkerRex67 views · 0 likes · 0 saves · 0 reposts · Posted Sep 24, 2026 · 0:18 · Explainers
OUR NOTEA data-driven diagram of a token bucket rate limiter, pairing a bar-style token stack with a live counter graph that update in sync with a running simulation; rendered in canvas only, no libraries.
THE CREATOR'S POST
3/ Ole Lehmann's list of what Opus 5.5 animation is good for was bookmarked 2,100 times this week. Number 8 was animated diagrams. So I asked for one.
One prompt: explain a token bucket rate limiter, canvas only, no libraries, every frame a pure function of time so my renderer can screenshot it.
- 193 seconds, 70 cents, 10K characters of HTML
- The count on screen matches the simulation at every frame. I asked for that and it held
- Same pipeline as every other video in this thread, untouched
This is the b-roll Ole means. It took less time than finding a stock clip.THE PROMPT
Tight technical constraint briefexplain a token bucket rate limiter, canvas only, no libraries, every frame a pure function of time so my renderer can screenshot it.MAKE ONE LIKE THIS
Three steps, using what the creators in this index used.- 1 · Copy the prompt
Use the prompt above as your starting point, then change the subject and the style.
HOW OTHERS WROTE THEIRS → - 2 · Direct it like an editor
- Ask for one self-contained HTML file on a fixed 1920×1080 stage.
- Link this video as the reference for pacing and style.
- Send two or three rounds of specific notes.
- 3 · Render it to MP4
A short piece like this can be screen-recorded, or captured frame by frame for exact timing.
TURN AN HTML ANIMATION INTO AN MP4 →
HOW IT WAS MADE
The creator didn't name their tools. Most videos like this are HTML, canvas or SVG animation written by Claude and screen-recorded or rendered to MP4 — how that works.
LOOK
data-vizexplainerminimal
Indexed Sep 28, 2026, 8:28 AM · Views as of indexing. Video and post © their creator.