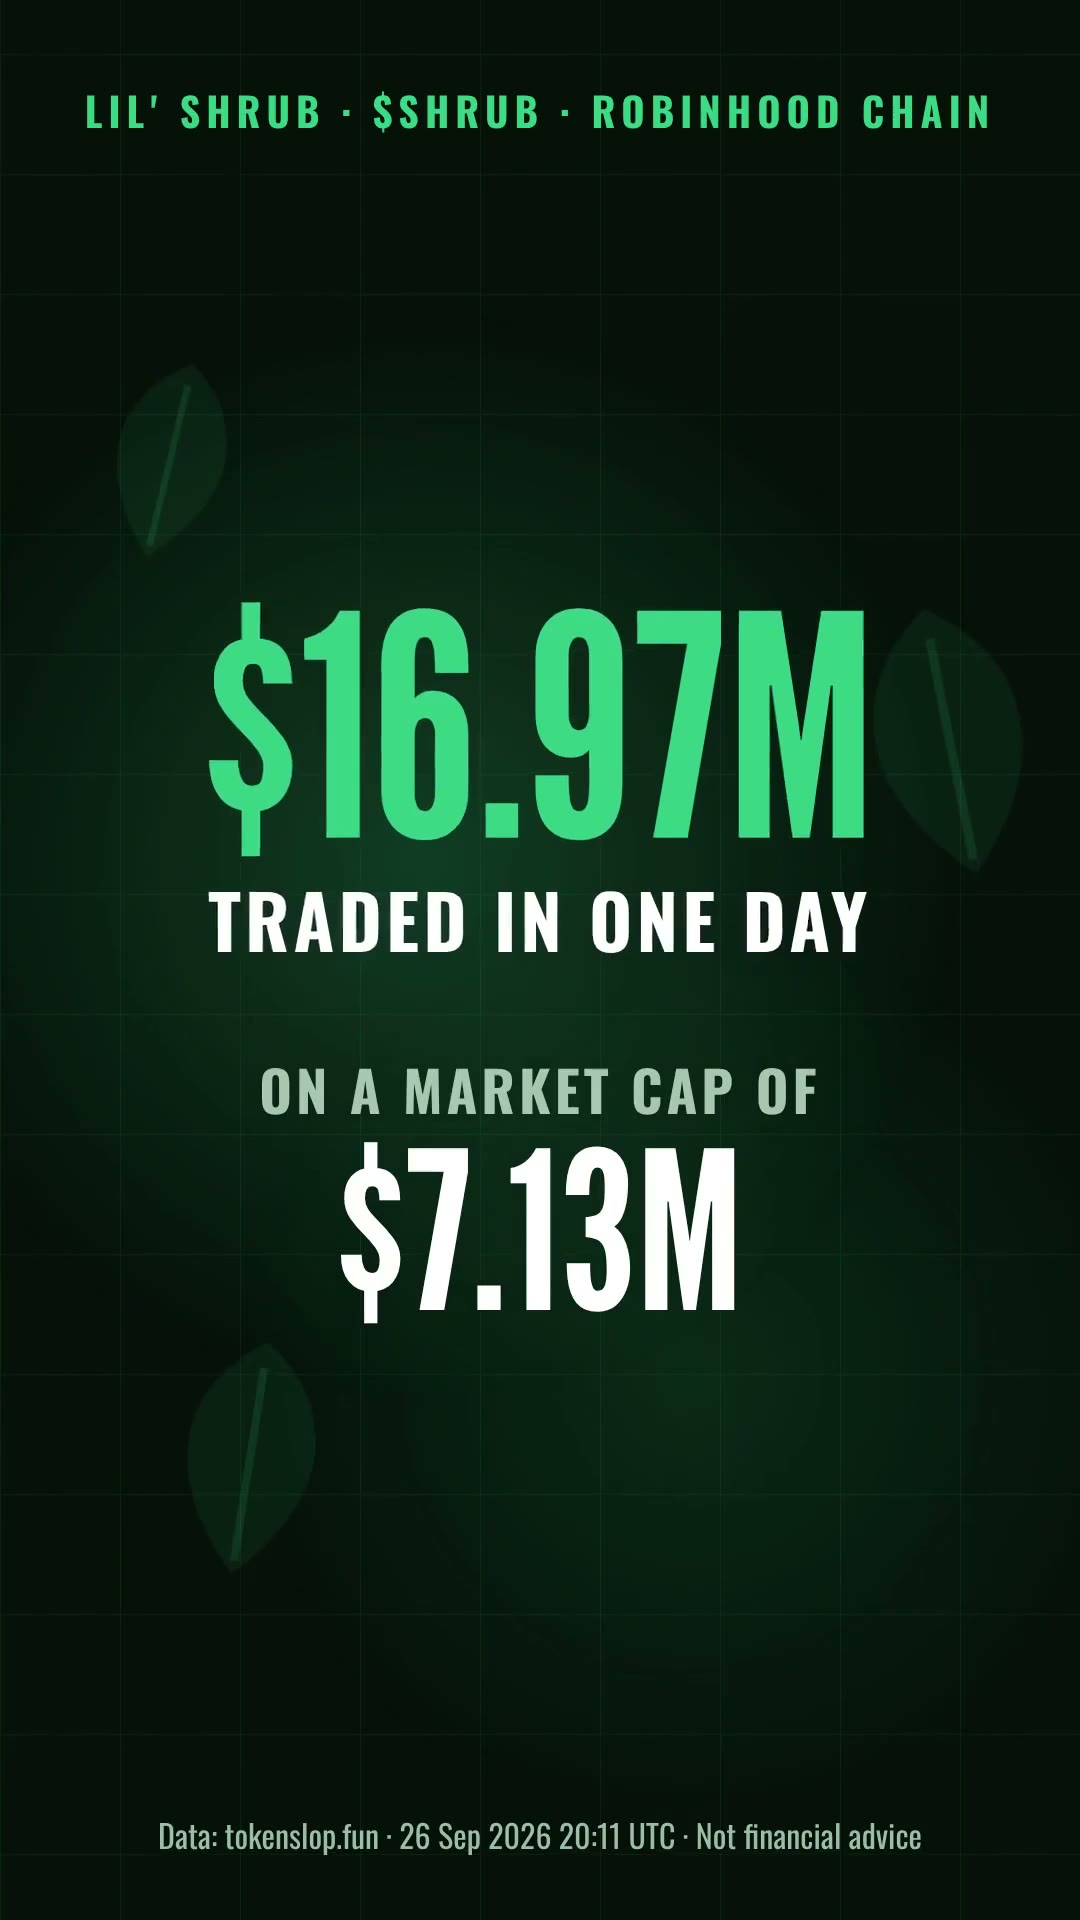
Data-driven vertical recap of a memecoin's trading stats

70 views · 1 likes · 0 saves · 0 reposts · Posted Sep 27, 2026 · 0:20 · Motion graphics
OUR NOTEA 20-second vertical video on the $SHRUB token showing $16.97M traded in a day on a $7.13M market cap; from a token address it pulled chain data, scripted, voiced and checked it in about 4 minutes.
I gave Opus 5.5 one thing: a token address.
4 minutes later it had pulled the live chain data, designed this video, written and voiced the script, and checked its own numbers. Every figure on screen comes from the data. It even added a beat about wallet concentration on its own.
It's an API now. Reply with a token address and I'll make you one.THE PROMPT
The creator didn't publish a prompt for this one. The post text is below.
MAKE ONE LIKE THIS
Three steps, using what the creators in this index used.- 1 · Copy the prompt
This creator didn't share a prompt. Start from our template instead.
PROMPT TEMPLATE → - 2 · Direct it like an editor
- Ask for one self-contained HTML file on a fixed 1920×1080 stage.
- Link this video as the reference for pacing and style.
- Send two or three rounds of specific notes.
- 3 · Render it to MP4
A short piece like this can be screen-recorded, or captured frame by frame for exact timing.
TURN AN HTML ANIMATION INTO AN MP4 →
The creator didn't name their tools. Most videos like this are HTML, canvas or SVG animation written by Claude and screen-recorded or rendered to MP4 — how that works.
Indexed Sep 28, 2026, 8:28 AM · Views as of indexing. Video and post © their creator.