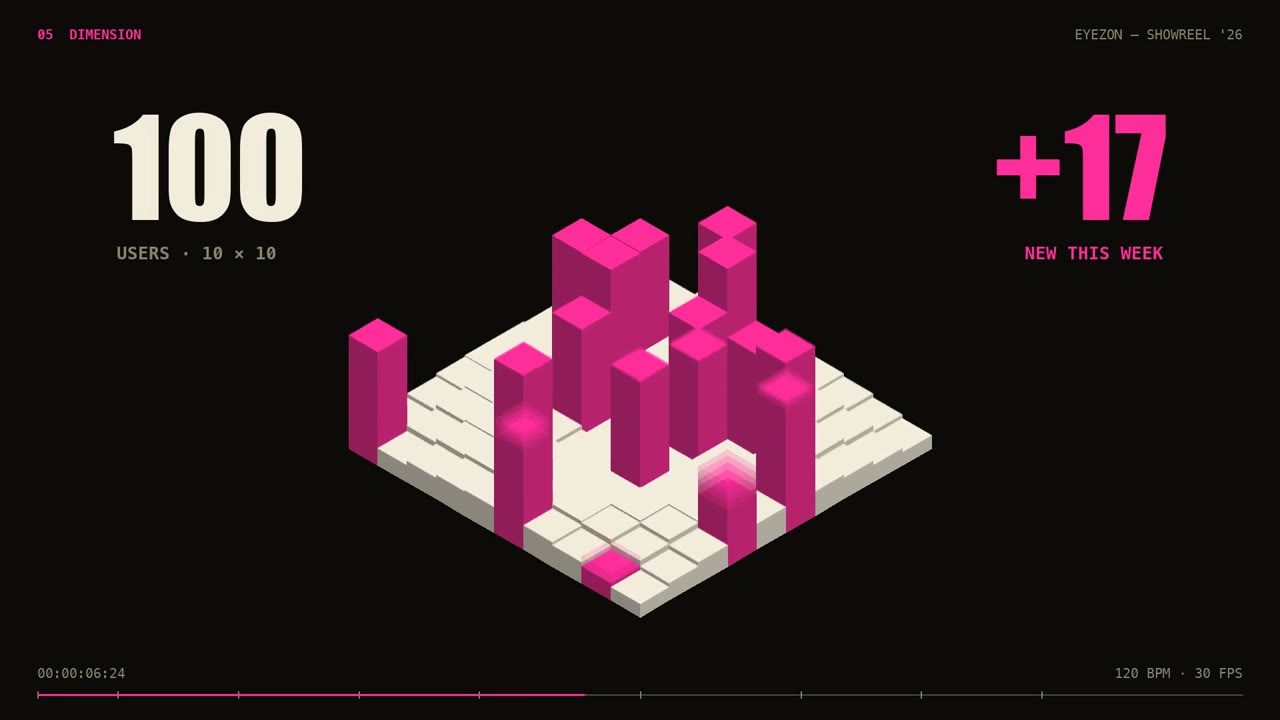
Eyezon showreel stacks a pink isometric bar chart
Sudiyasa 👁️VERIFIED
@Sudiyasa_349 views · 3 likes · 1 saves · 1 reposts · Posted Sep 26, 2026 · 0:15 · Motion graphics
OUR NOTEA showreel made to thank the first 100 users of the bot Eyezon, from the viral showreel prompt; shows a pink isometric bar chart on a 10x10 grid marking '100 users' and '+17 new this week.'
THE CREATOR'S POST
Celerating 100 @eyezonbot users 🎉
(Opus 5.5 bringing us to the next phase of marketing)
Prompt: "make a dynamic 15-second motion graphics video that shows what an incredible motion designer you are, like it's your showreel for a résumé. go all out do this to thank the first 100 users of @eyezonbot"THE PROMPT
One-shot showreel briefmake a dynamic 15-second motion graphics video that shows what an incredible motion designer you are, like it's your showreel for a résumé. go all out do this to thank the first 100 users of
@eyezonbotMAKE ONE LIKE THIS
Three steps, using what the creators in this index used.- 1 · Copy the prompt
Use the prompt above as your starting point, then change the subject and the style.
HOW OTHERS WROTE THEIRS → - 2 · Direct it like an editor
- Ask for one self-contained HTML file on a fixed 1920×1080 stage.
- Link this video as the reference for pacing and style.
- Send two or three rounds of specific notes.
- 3 · Render it to MP4
A short piece like this can be screen-recorded, or captured frame by frame for exact timing.
TURN AN HTML ANIMATION INTO AN MP4 →
HOW IT WAS MADE
The creator didn't name their tools. Most videos like this are HTML, canvas or SVG animation written by Claude and screen-recorded or rendered to MP4 — how that works.
LOOK
isometricdata-vizproduct-ad
Indexed Sep 28, 2026, 8:28 AM · Views as of indexing. Video and post © their creator.