Western Europe's summer 2026 heat and drought in vertical charts

21 views · 0 likes · 0 saves · 0 reposts · Posted Oct 2, 2026 · 1:11 · Explainers
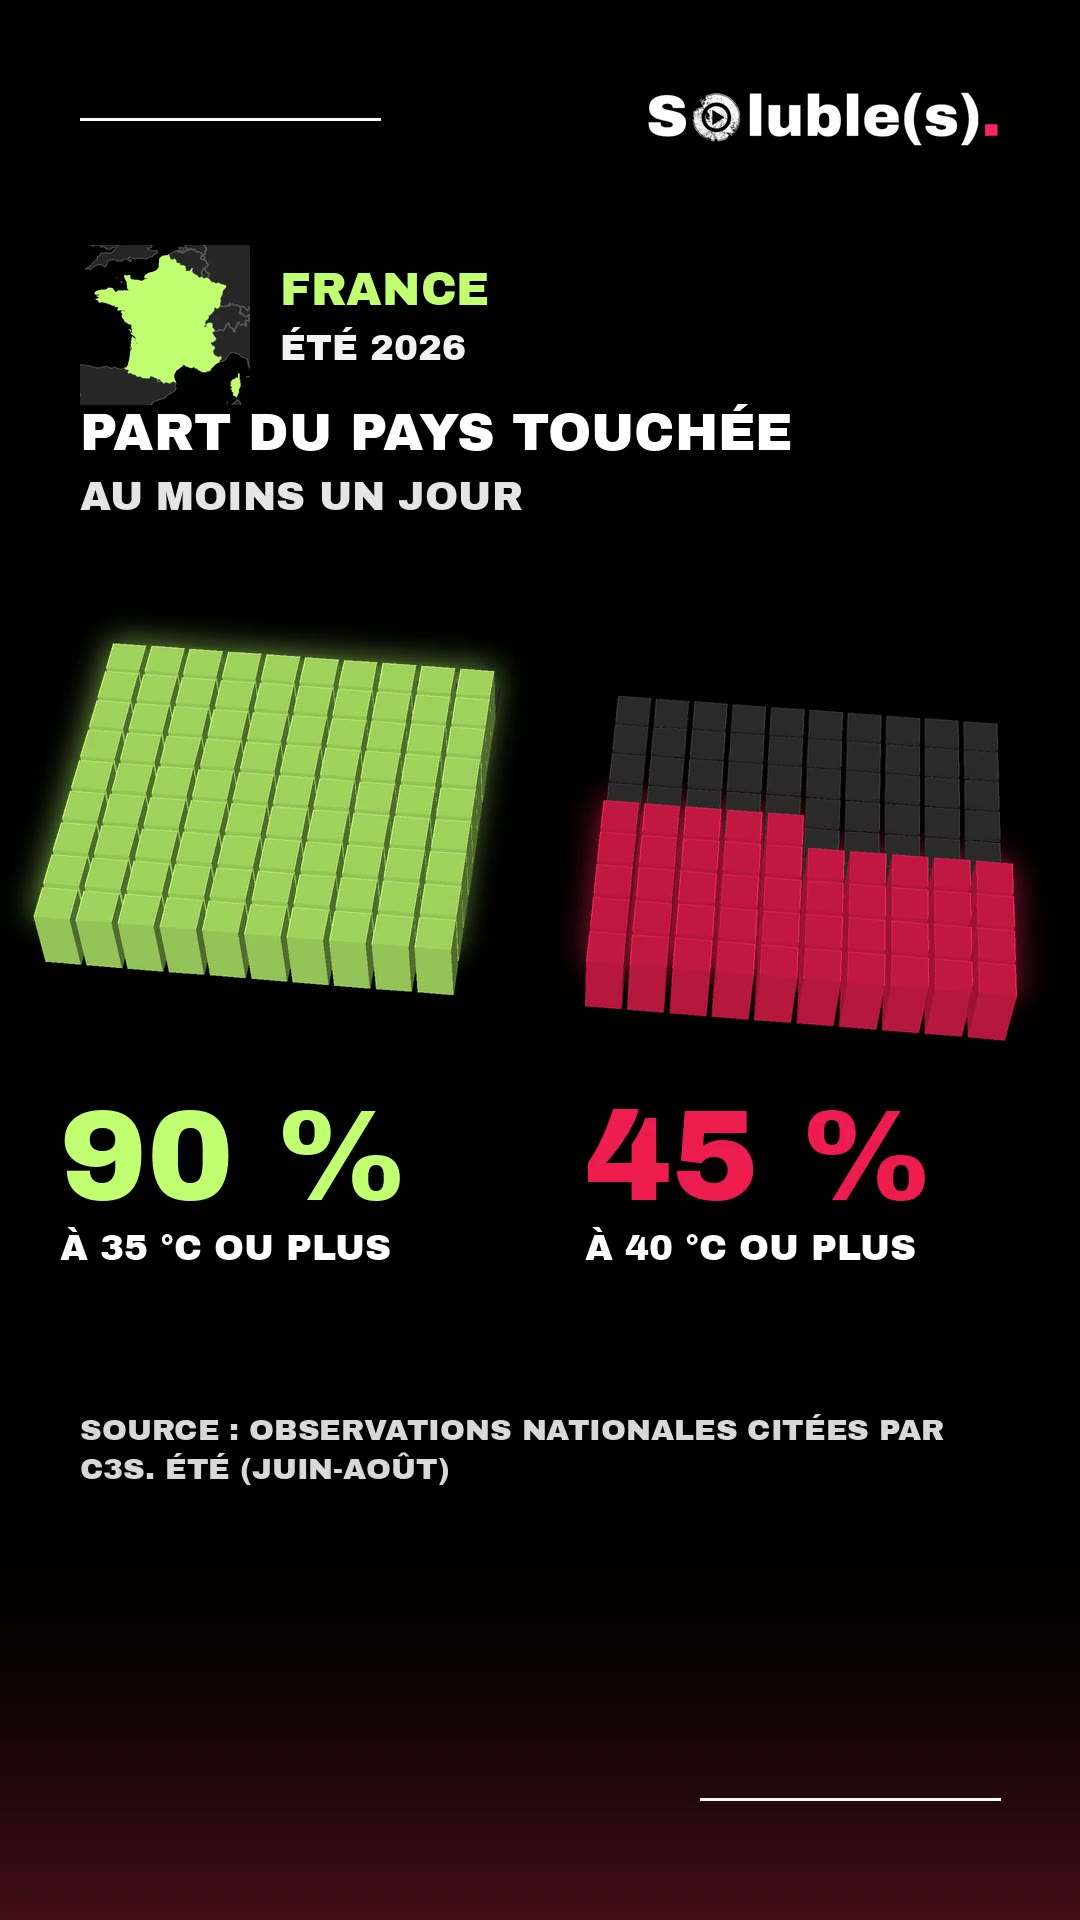
OUR NOTEA 71-second vertical French-language data video for the creator's Soluble(s) brand, mapping heat across Western Europe and France and record-low river flows with 3D block charts drawn from a Copernicus report; the creator says visuals and sound were coded in five iterations.
Je poursuis mes petits essais en mode Sonnet 5.5 (médium), un angle, ma charte, le pdf du bilan de Copernicus, et 5 itérations.
100% codée par Claude qui a aussi fait les sons.THE PROMPT
The creator didn't publish a prompt for this one. The post text is below.
MAKE ONE LIKE THIS
Three steps, using what the creators in this index used.- 1 · Copy the prompt
This creator didn't share a prompt. Start from our template instead.
PROMPT TEMPLATE → - 2 · Long piece? Give Claude a framework
- agent-storyboardStoryboarding short videos with an agent★ 353
- claude-faceless-shorts-creatorFaceless YouTube Shorts with synced captions★ 269
- book-video-factoryChinese book-review short videos with audit trail★ 105
- 3 · Render it to MP4
For a longer piece like this one, render with a framework so the timing is exact on every take.
CLAUDE CODE + HYPERFRAMES / REMOTION →
The creator didn't name their tools. Most videos like this are HTML, canvas or SVG animation written by Claude and screen-recorded or rendered to MP4 — how that works.
Indexed Oct 7, 2026, 11:34 AM · Views as of indexing. Video and post © their creator.