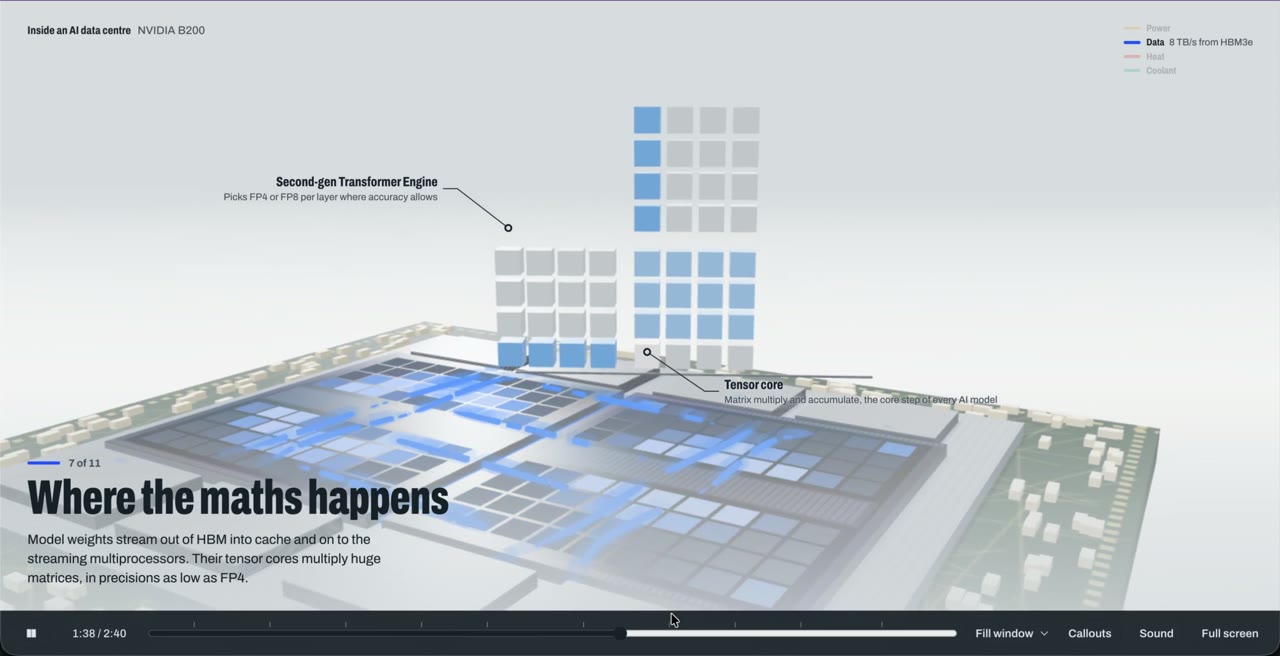
Isometric data-center diagram tracing power and heat

1.3K views · 7 likes · 5 saves · 0 reposts · Posted Sep 26, 2026 · 1:38 · 3d scenes
OUR NOTEA 2.5-minute explainer film tracing power, data, and heat through an isometric 3D data center, from the grid down to the chip, built as a single HTML file from a one-line prompt.
One prompt to Claude Opus 5.5 on High:
“Show me what goes on inside an AI data centre.”
35 minutes later → a 2.5-minute 3D film, going from the power grid all the way down to Blackwell silicon.
One HTML file.
Zero 3D assets.
And it cost me just ~7% of my usage. 🤯
This is getting ridiculous.THE PROMPT
One-line explainer promptShow me what goes on inside an AI data centre.MAKE ONE LIKE THIS
Three steps, using what the creators in this index used.- 1 · Copy the prompt
Use the prompt above as your starting point, then change the subject and the style.
HOW OTHERS WROTE THEIRS → - 2 · Long piece? Give Claude a framework
- OpenMontageEnd-to-end AI video production pipelines★ 61.5k
- hyperframesHTML/CSS-driven deterministic video rendering★ 53.5k
- hypitCloning existing videos into new variants★ 16.6k
- 3 · Render it to MP4
For a longer piece like this one, render with a framework so the timing is exact on every take.
CLAUDE CODE + HYPERFRAMES / REMOTION →
The creator didn't name their tools. Most videos like this are HTML, canvas or SVG animation written by Claude and screen-recorded or rendered to MP4 — how that works.
I tried creating motion graphics with Claude Opus 5.5… and this is the result 🤯 From yesterday, bit by bit about 1 hour of work in total. I made a 3D animation using the NVIDIA Blackwell GPU as the subject: → Enter the data center → Open the server → Disassemble the GPU → Go deeper into the chip → Pass through circuit...
Indexed Sep 28, 2026, 8:28 AM · Views as of indexing. Video and post © their creator.